Group Secondary B
From Step 2007 Wiki
| Line 21: | Line 21: | ||
Students then explored contour lines by making a three-dimensional model of a map section. | Students then explored contour lines by making a three-dimensional model of a map section. | ||
[[Image:SecB7.jpg]] | [[Image:SecB7.jpg]] | ||
| - | [[Image: | + | [[Image:SecB6.jpg]] |
[[Image:SecB8.jpg]] | [[Image:SecB8.jpg]] | ||
Revision as of 22:26, 20 July 2007
QUESTION
Describe how, as you worked together, your group incorporated the concept of global climate change into your lesson. Include 1-2 sentences per person and up to four photos.
Sample of text for a photo: File:Group Secondary B.jpg
Topographic maps can be used to measure amounts of coastal change.
Topographic maps can be used to look at changes in thaw lakes in a Arctic environments.
One purpose for teaching students how to use topographic maps is so they are able to determine the amount of coastal change by comparing early topographic maps to more recent maps.
Students may also use topographic maps to make inferrences regarding changes in permafrost by looking at changes in thaw lakes over time.
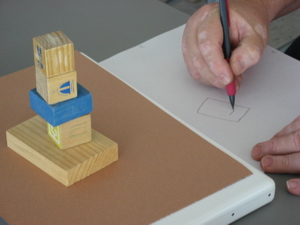
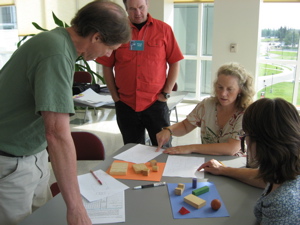
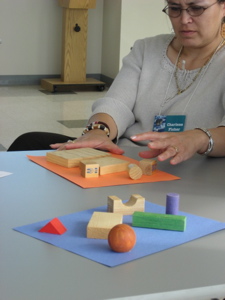 Gear Up activity had students map position of objects on a sheet of paper.
Students exchanged maps to draw a path to navigate through the objects by the shortest path while going over at lest one object.
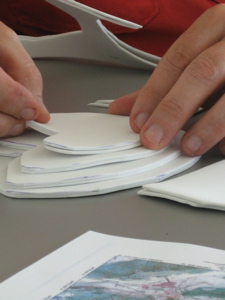
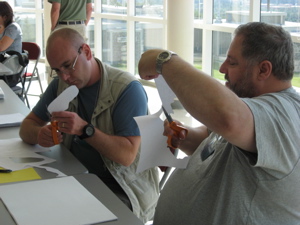
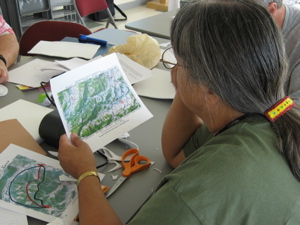
Students then explored contour lines by making a three-dimensional model of a map section.
- -)
